
In Vitro Screening for Vascular Liability
Predict off target vasoactivity with our high throughput electrophysiological screening assay
Unexpected vasoactivity, which has recently been shown to contribute to drug attrition (Insani et al., 2024), tends to be found in vivo and ex vivo during the later stages of preclinical drug development. The cost of discovering vascular liabilities at such a late stage is substantial: both in terms of loss of competitiveness and on timing of your critical path. We are working to address this challenge.
The in vitro screening solution for vascular activity offered by ApconiX addresses this challenge. Drug candidates can be tested much earlier in the drug discovery process, which allows developers to understand the underlying mechanisms of any observed adverse blood pressure changes and improve risk stratification.
Our in vitro screening solution for vascular activity means that you can understand and improve risk stratification for adverse effects on blood pressure much earlier in the drug discovery process. With ApconiX you can:
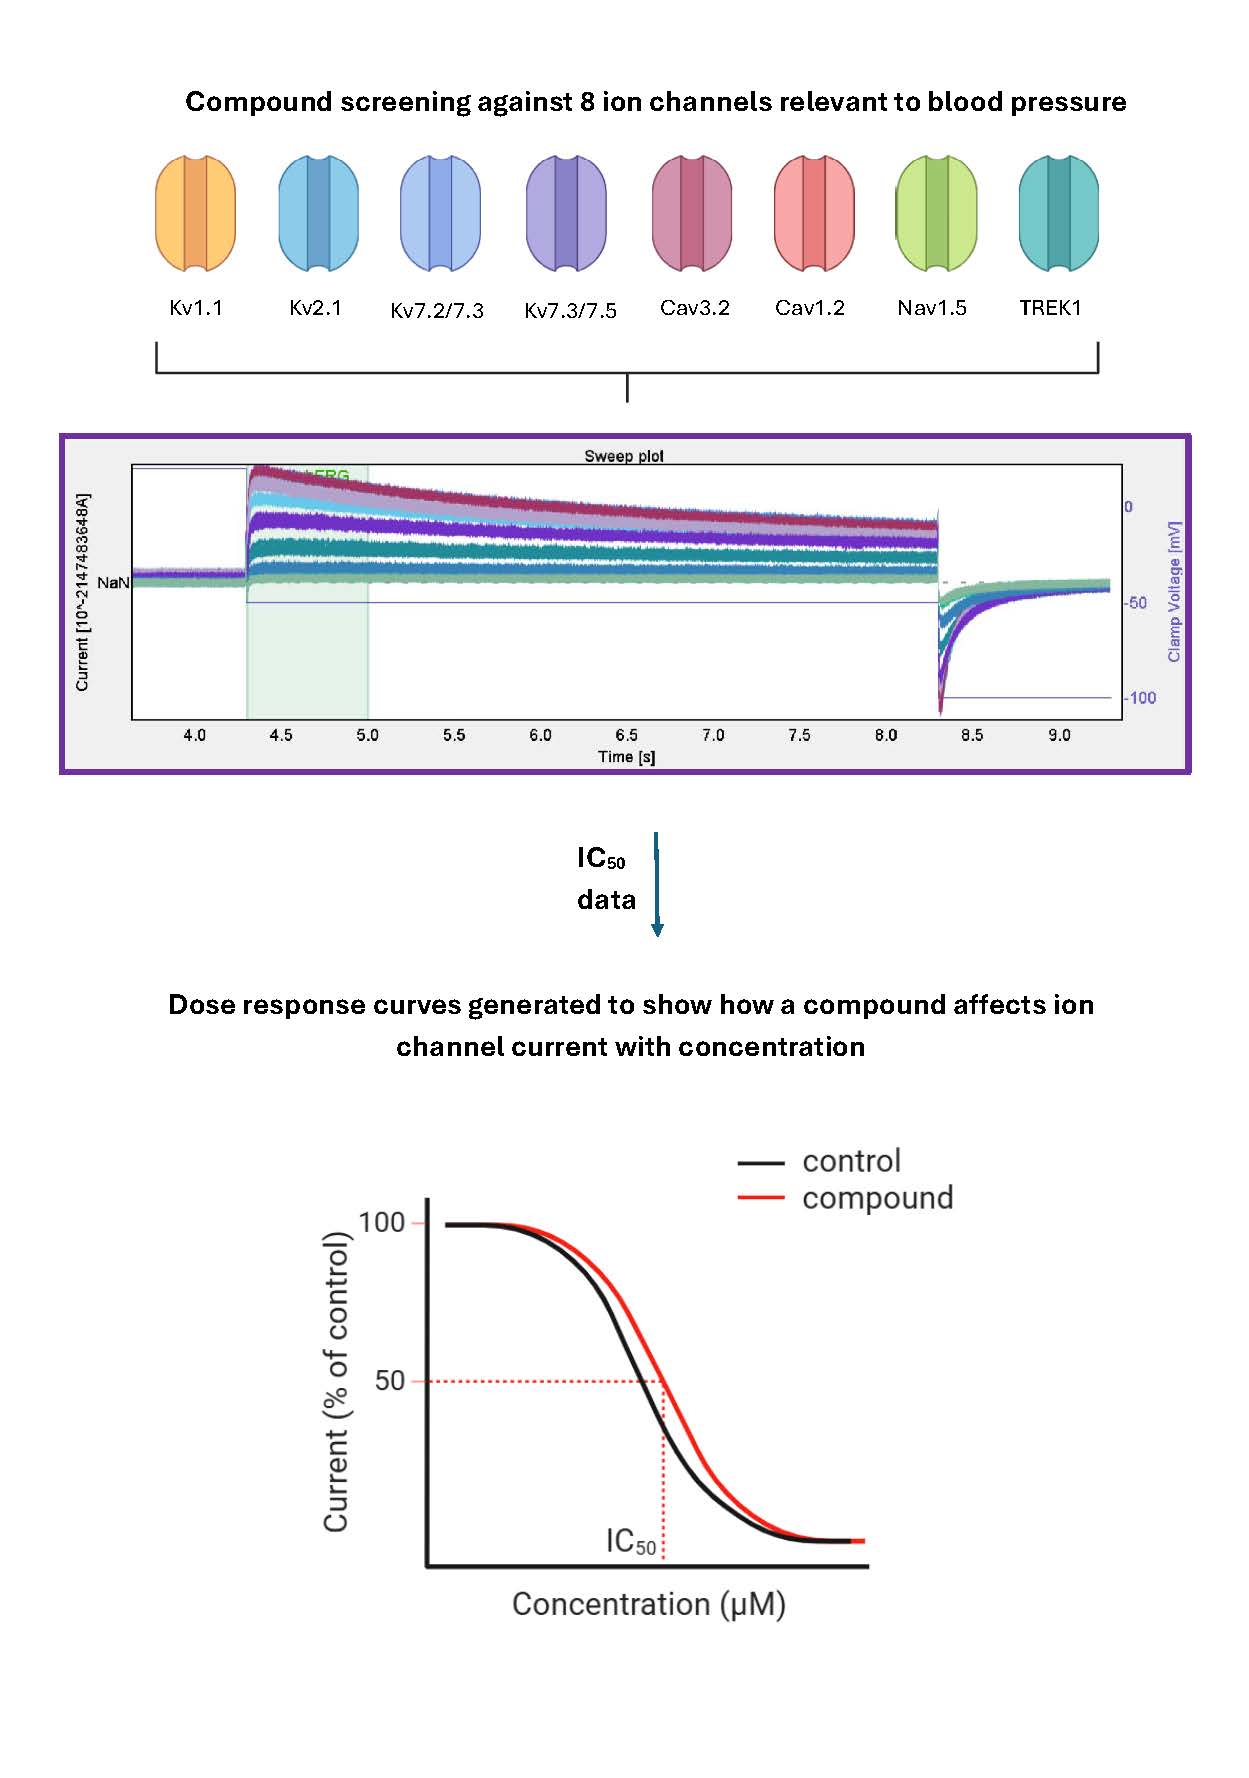
- Screen your drug candidate against a diverse panel of vascular ion channels (Kᵥ1.1, Kᵥ2.1, Kᵥ7.2/7.3, Kᵥ7.3/7.5, Caᵥ3.2, Caᵥ1.2, TREK1, Naᵥ1.5) using whole cell automated patch clamp (Sophion’s QPatch).
- Identify exactly which ion channels your drug shows activity against based on IC₅₀ values derived from a four parameter logistic fit of normalised concentration response data.
Figure: Sweep plots generated in Sophion Software are used to generate dose response curves for each ion channel. In each graph the log of molar concentration of the test compound is plotted against the post compound current, expressed as a percentage of the pre compound signal. Data are normalised such that a value of 100% = no drug effect. Each data point is plotted from a minimum of N>3 cells. The line of best fit and IC50 values are generated from the individual cell data points.

Benefits of In Vitro Screening for Vascular Liability:
- Understand underlying biological mechanisms — our in vitro screen can show you exactly which ion channels are modulated upon drug application
- Evaluate dosage risk — our results show ion channel drug response at a range of clinically relevant concentrations
- Understand underlying biological mechanisms — our in vitro screen can show you exactly which ion channels are activated upon candidate drug administration.
- Reduces reliance on animal studies — using in vitro assays such as these help demonstrate your commitment to the 3Rs (Replacement, Reduction and Refinement).
- Reduced attrition — reduced chance of drug attrition due to vascular liability further down the pipeline
- Save resources and money — rule out unsuitable drug candidates before the clinical stage begins
In vitro screening can detect drug induced ion channel activity
We tested eleven marketed drugs known to affect blood pressure (table 1) alongside two negative controls (acetaminophen and aspirin). The test set of drugs were chosen because of their clinical relevance: with some having known mechanisms of adverse action on, and others used in, reducing blood pressure. We chose dose ranges of 100uM to 0.3uM to screen clinically appropriate Cmax values. Ion channels were chosen based on expression, function and pharmacology — as most of which are expressed in the vasculature and can directly affect vascular smooth muscle.
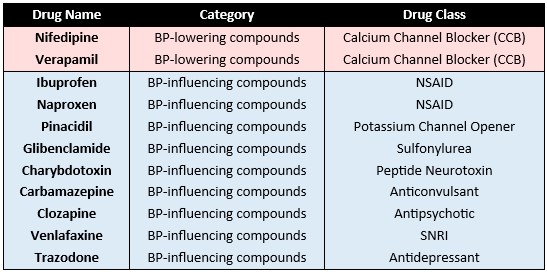
Drugs known to reduce blood pressure, nifedipine and verapamil, blocked Caᵥ1.2 and Caᵥ3.2 channels but also displayed inhibitory activity at other key vascular ion channels Kᵥ2.1 and TREK1. Nifedipine and verapamil are known calcium channel blockers used to lower blood pressure and exhibited Caᵥ1.2 inhibition with IC₅₀s of 0.4 and 2.2 respectively. Nifedipine and verapamil also displayed inhibitory activity at TREK1, Naᵥ1.5 and Kᵥ1.1 and 2.1 channels.
As expected for negative controls, acetaminophen and aspirin showed no ion channel activity.
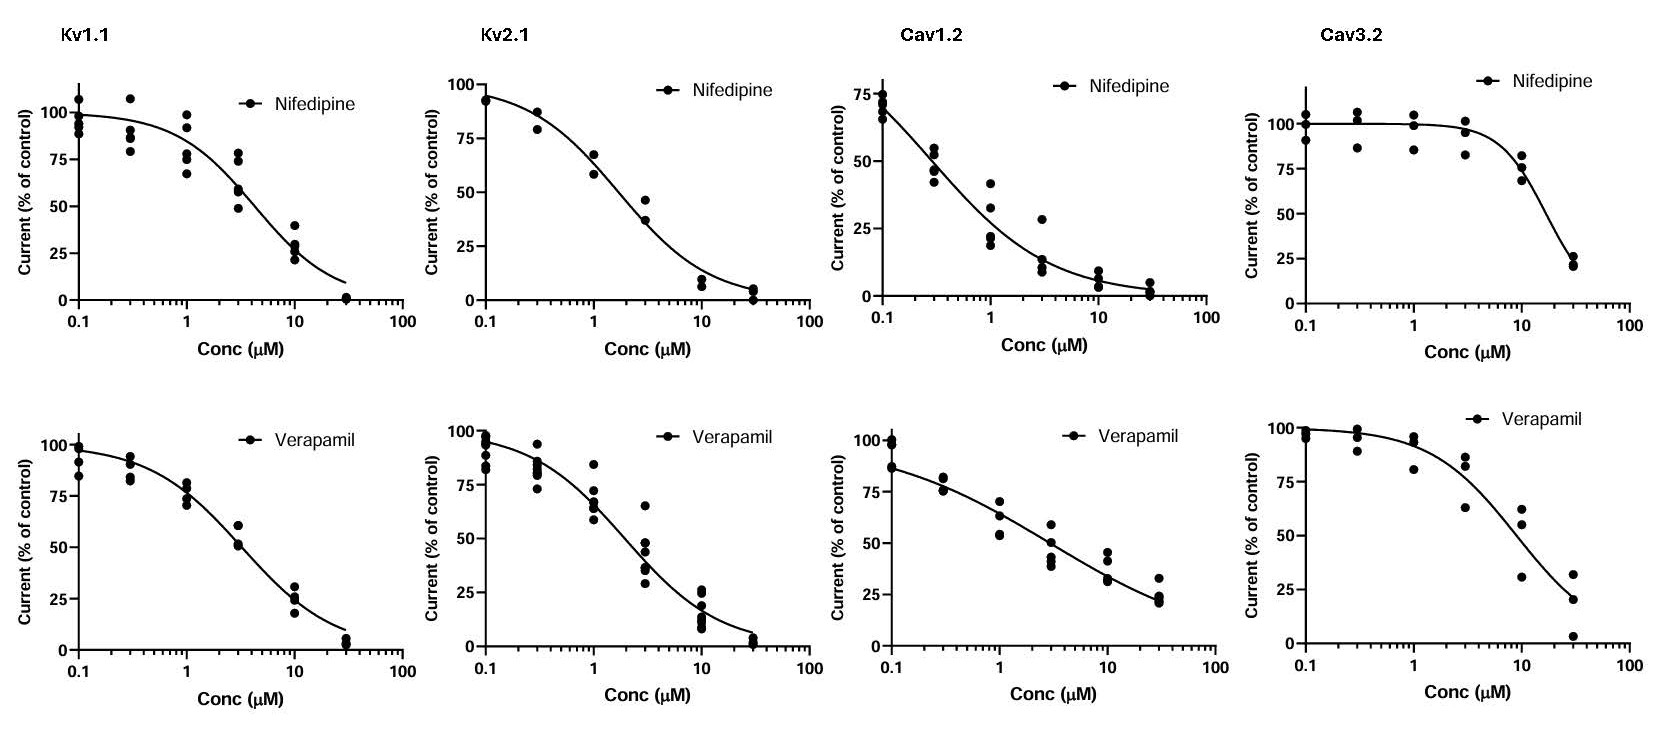
Figure: Dose response curves showing the effect of nifedipine and verapamil on Kᵥ1.1, Kᵥ2.1, Caᵥ1.2 and Caᵥ3.2 ion channels. In each graph the log of molar concentration of the test compound is plotted against the post-compound current and expressed as a percentage of the pre-compound signal. Data are normalised such that a value of 100% = no drug effect. Each data point is plotted from a minimum of N > 3 cells. The line of best fit and IC₅₀ values are generated from the individual cell data points.
Exploring the mechanisms of action of other vasoactive compounds
Trazodone has been associated with orthostatic hypotension and is reported to have hypertensive effects in humans. Trazodone inhibited every channel in the panel to some degree, except for Kᵥ1.1 and the Kᵥ7 channels. The IC₅₀ for trazodone inhibition of Kᵥ2.1 was 5 mM, which falls within the Cₘₐₓ range for blood plasma concentration (0.2 to 5.1 mM) suggesting that inhibitory activity at Kᵥ2.1 could be a potential mechanism of action for the observed hypertensive effects of this drug on blood pressure.
Whilst clozapine is known to change blood pressure, its mechanism is not fully understood. Clozapine displayed inhibitory blocking activity at all ion channels in this panel, including Kᵥ channels, Naᵥ1.5 and Caᵥ channels. Clozapine activity was seen at multiple vascular ion channels including TREK1 and Kᵥ2.1 with IC₅₀ values of 2.5 mM and 10.6 mM respectively. These IC₅₀ values fall slightly outside of the therapeutic range for blood plasma concentration but well within the toxic serum concentration range (1.84 to 29.07 mM). Therefore, our findings could indicate that low level ion channel inhibition is a possible mechanism of action for clozapine’s perturbation of blood pressure.
The activity of vasoactive compounds on ion channels in our vascular panel is suggestive of blood pressure effects mediated through ion channel modulation. Therefore, in vitro screening of potential drug candidates for ion channel activity could uncover effects on blood pressure, and critically, identify vascular liabilities early in the drug discovery pipeline.
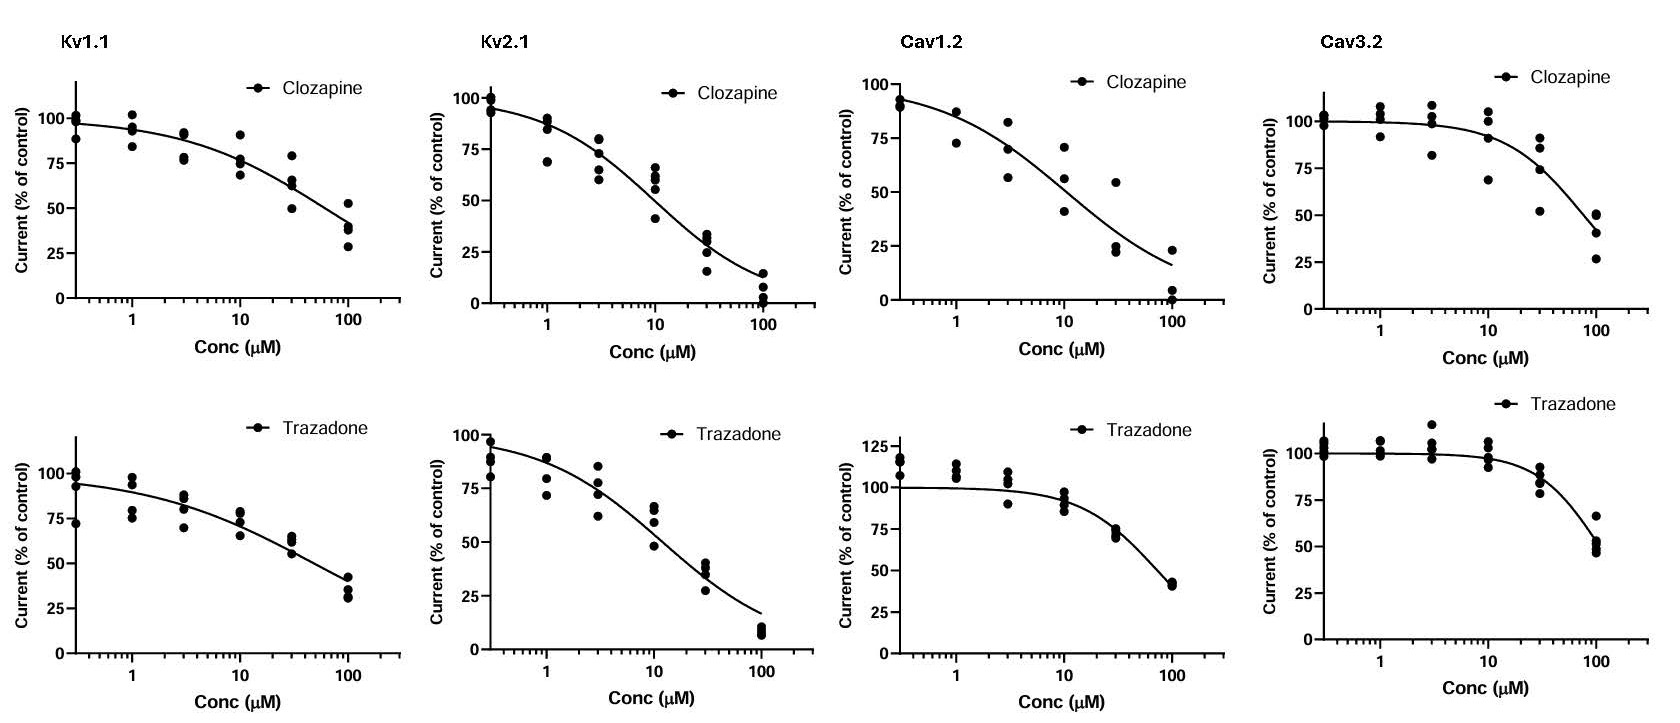
Figure: Dose response curves showing the effect of clozapine and trazodone on Kᵥ1.1, Kᵥ2.1, Caᵥ1.2 and Caᵥ3.2 ion channels. In each graph the log of molar concentration of the test compound is plotted against the post-compound current, expressed as a percentage of the pre-compound signal. Data are normalised such that a value of 100% = no drug effect. Each data point is plotted from a minimum of N > 3 cells. The line of best fit and IC₅₀ values are generated from the individual cell data points.